
Dashboard
The Dashboard is a visual representation of your payment data. The dynamic and interactive main page shows real-time data on transactions, charges, and subscriptions. Filter the data in the charts and graphs to get a more precise understanding of your payment environment. As a result, the dashboard enables you to make better, more informed, and data-driven decisions.
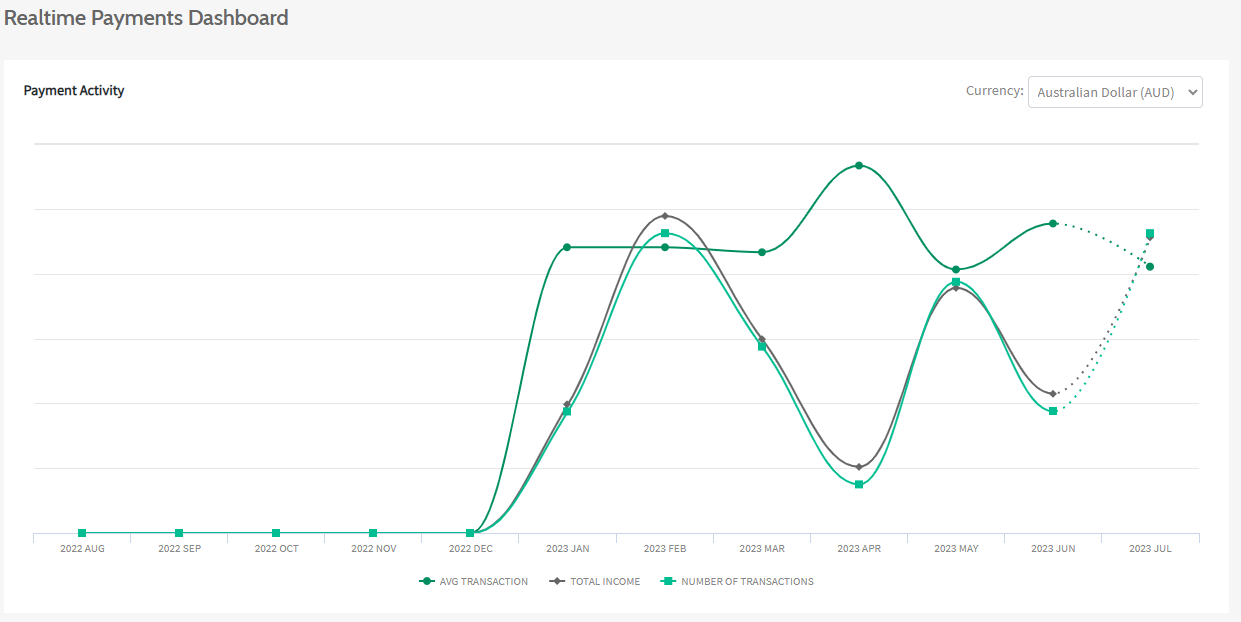
Payment Activity
The graph displays the monthly statistics of your account’s transactions over the last 12 months. Transactions here are equivalent to charges with type = sale and status = complete, i.e. completed charges. The chart displays a snapshot of the average transaction, total transaction revenue/income, and the total number of transactions per month. Press Load data to view the statistics. Then, click on a status to mark or unmark it for a more detailed picture.
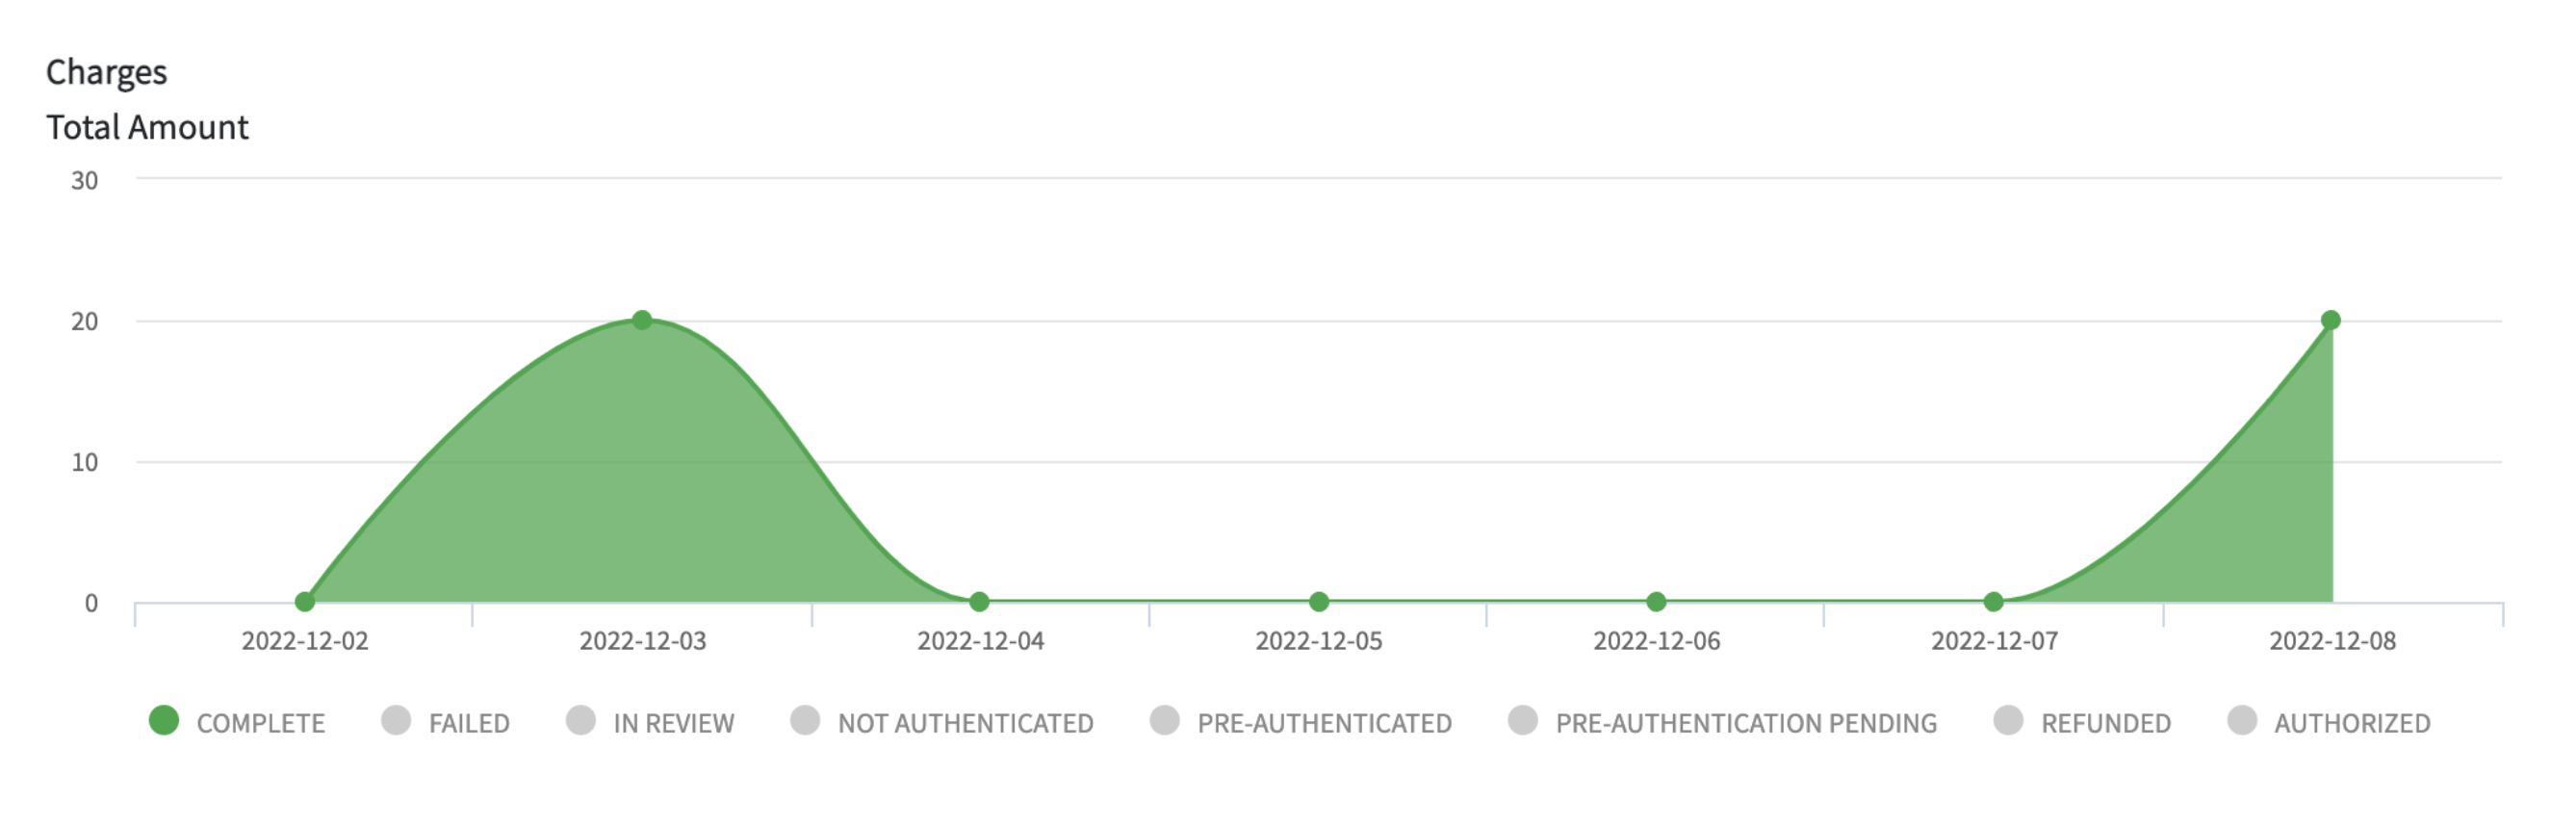
Charges
The graph displays the total amount of your account’s charges over the last 7 days. The statuses are Complete, Failed, In Review, Not Authenticated, Pre-Authenticated, Pre-Authentication Pending, Refunded, and Authorised. Press Load data to view the statistics. Then, click on a status to mark or unmark it for a more detailed picture.
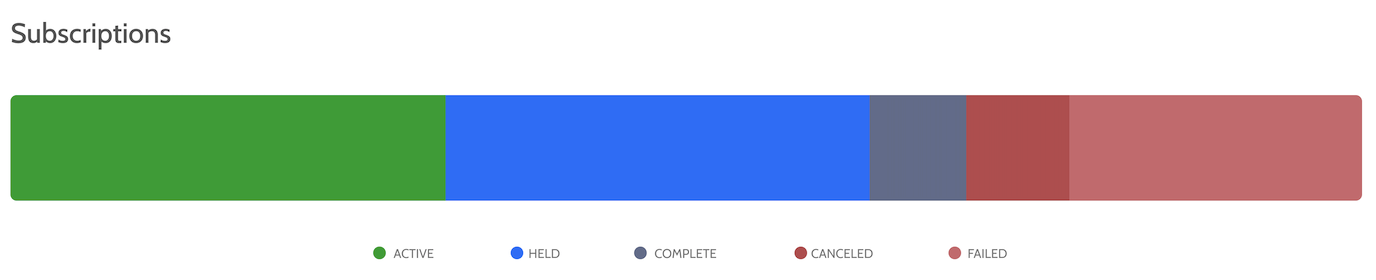
Subscriptions
The block diagram displays the total number of your account’s subscriptions per status - Active, Held, Completed, Canceled, and Failed. Press Load data to view the statistics. Then, click on a status to mark or unmark it for a more detailed picture.
FAQs
You can view a detailed breakdown of your charges in the Charges section of your powerboard account.
Updated 4 months ago